Page 1 of 1
ViewPolar: amplitude axis scale
Posted: Wed Nov 04, 2015 4:47 pm
by ahe
The values on the scale do not represent the actual values for that position.
Example using the demo application:
Scroll to amplitude 0 to 5 and mark a section from 1 to 2.
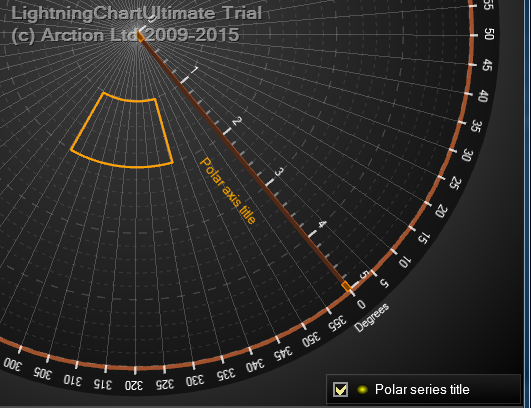
- Bug_1.png (103.35 KiB) Viewed 12041 times
Place the mouse cursor on the amplitude axis and use the mouse wheel. The selection will move accordingly, but the displayed axis scale will stay still and become invalid:
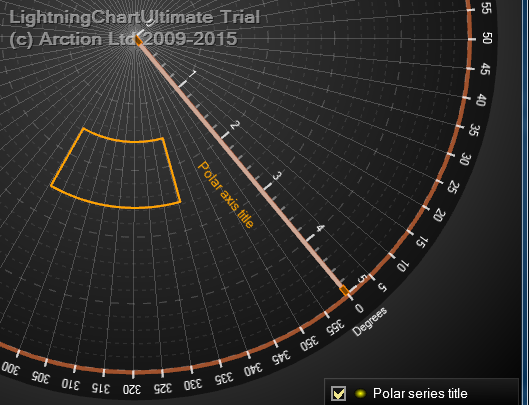
- Bug_2.png (103.62 KiB) Viewed 12041 times
Also, due to rounding errors, the intervals can vary, e.g. showing 0,1,2,2,3,4
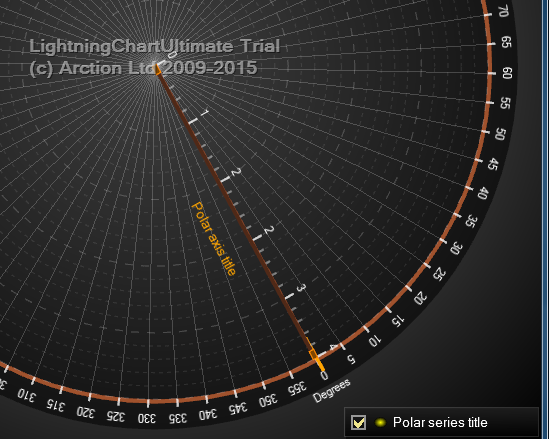
- Bug_3.png (113.96 KiB) Viewed 12041 times
The screenshots are made with SDK 6.5.1, the issues are reproduceable in 6.5.4.
Re: ViewPolar: amplitude axis scale
Posted: Wed Nov 04, 2015 4:51 pm
by ahe
Almost forgot... Labels can overlap:
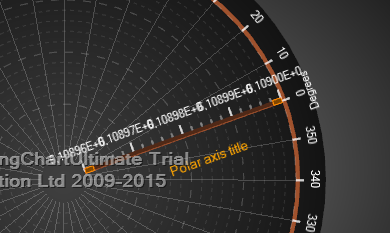
- Bug_4.png (55.88 KiB) Viewed 12039 times
Re: ViewPolar: amplitude axis scale
Posted: Thu Nov 05, 2015 6:48 am
by ArctionPasi
This is not actually a bug, rather limitation of design.
The count of divisions can be controlled by MajorDivCount. That means the number of ticks is MajorDivCount +1.
The first tick is at MinAmplitude. Last tick is at MaxAmplitude. Between this range the ticks are evenly spaced.
The Labels don't have support for overlapping check. The labels formatting can be changed by setting AutoFormatLabels = false, and by subscribing SupplyCustomAngleString and SupplyCustomAmplitudeString (note, both are needed).
Code: Select all
axis.SupplyCustomAngleString += axis_SupplyCustomAngleString;
axis.SupplyCustomAmplitudeString += axis_SupplyCustomAmplitudeString;


 void axis_SupplyCustomAmplitudeString(object sender, AxisPolarBase.AxisAmplitudeEventArguments args)
        {
            args.ValueAsString = args.Value.ToString("0.00");
        }

        void axis_SupplyCustomAngleString(object sender, AxisPolarBase.AxisAngleEventArguments args)
        {
            args.AngleAsString = args.Angle.ToString("0.00");
        }
Like this, you will see decimal numbers instead of integers.
Re: ViewPolar: amplitude axis scale
Posted: Thu Nov 05, 2015 2:02 pm
by ahe
CustomAxisLabels in combination with adjusting the values on axis_RangeChanged (rounding to the next "nice" value) seems to result in acceptable behaviour.
Still, I would prefer the amplitude axis to work like the ViewXY axis...