A forum dedicated to WinForms version of LightningChart Ultimate.
Moderator: Queue Moderators
-
Felix
- Posts: 72
- Joined: Tue Oct 29, 2013 8:10 am
Post
by Felix » Fri Feb 28, 2014 11:38 am
Hello Pasi,
there is for the Chart or for the SurfaceGridSeries3D object, a value so that nothing is drawn?
I have this form, see Figure 1 and would like to take the central recess that the interpolation does not run until the value 0, but is cut off in Figure 2.
The form I fill with initial-1E9f which is transparent in the color palette.
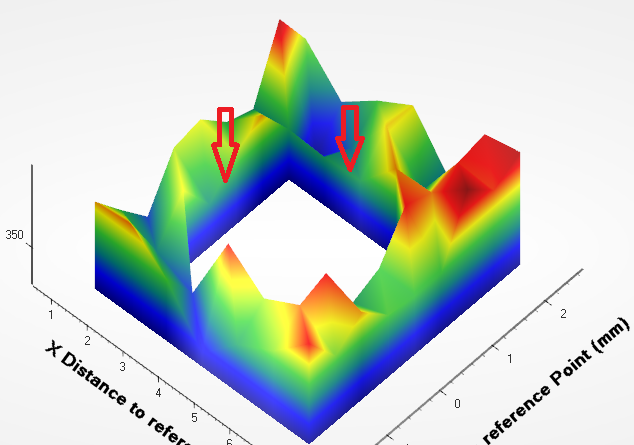
- Figure 1
- Chart.PNG (100.86 KiB) Viewed 6394 times
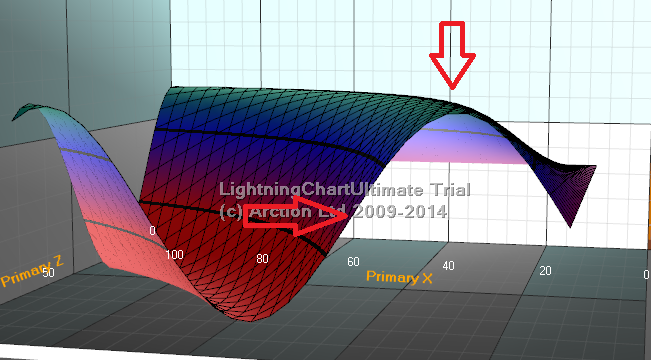
- Figure 2
- Cut Edges Chart.png (159.48 KiB) Viewed 6394 times
Thanks
-
ArctionPasi
- Posts: 1367
- Joined: Tue Mar 26, 2013 10:57 pm
- Location: Finland
-
Contact:
Post
by ArctionPasi » Sun Mar 02, 2014 3:21 pm
We don't have handling for any special value that we could use a "void" point. But by quickly testing, by setting value = double.NaN it will not render anything on that position, and seems to Intel-compatible too. For AMD and NVidia you can use Double.MinValue and Double.NegativeInfinity as well.
Note that in Intel HD 4000 (at least) you'll need to set WireframeType = None, otherwise it will render strange lines.
Also set ColorSaturation high (90...100) to prevent light normals from getting mixed up.
Code: Select all
 private void CreateChart()
        {
            //Create new chart
            m_chart = new LightningChartUltimate();

            //Disable rendering, strongly recommended before updating chart properties
            m_chart.BeginUpdate();

            //Set 3D as active view
            m_chart.ActiveView = ActiveView.View3D;

            //Chart parent must be set
            m_chart.Parent = this;

            //Fill parent area with chart
            m_chart.Dock = DockStyle.Fill;

            //Chart name
            m_chart.Name = "Simple surface grid 3D chart";

            //Set x-rotation
            m_chart.View3D.Camera.RotationX = 38;

            //Add 3D surface grid
            SurfaceGridSeries3D gridSeries = new SurfaceGridSeries3D(m_chart.View3D, Axis3DBinding.Primary, Axis3DBinding.Primary, Axis3DBinding.Primary);
            m_chart.View3D.SurfaceGridSeries3D.Add(gridSeries);

            //Set grid X and Y ranges
            gridSeries.RangeMinX = 10;
            gridSeries.RangeMaxX = 90;
            gridSeries.RangeMinZ = 10;
            gridSeries.RangeMaxZ = 90;
			gridSeries.WireframeType = SurfaceWireframeType.None;
			gridSeries.ColorSaturation = 100;

            //Set grid size as column and row count
            const int iRowCount = 30;
            const int iColumnCount = 30;
            gridSeries.SizeX = iColumnCount;
            gridSeries.SizeZ = iRowCount;

            //Set Y values for nodes
            double dY = 0;
            for (int iNodeX = 0; iNodeX < iColumnCount; iNodeX++)
            {
                for (int iNodeZ = 0; iNodeZ < iRowCount; iNodeZ++)
                {
                    dY = 35.0 + 30.0 * Math.Sin(0.01 * (double)(iNodeX * iNodeZ));
                    gridSeries.Data[iNodeX, iNodeZ].Y = dY;
                }
            }

			double dontShowValue = double.NaN; //Works for AMD, NVidia and Intel

			for (int iNodeX = 5; iNodeX < 25; iNodeX++)
			{
				for (int iNodeZ = 5; iNodeZ < 25; iNodeZ++)
				{
					gridSeries.Data[iNodeX, iNodeZ].Y = dontShowValue;
				}
			}
            //Notify new values are ready
            gridSeries.InvalidateData();

            //Allow chart rendering
            m_chart.EndUpdate();
        }

- Surface with NaN values
- surfaceWithNans.jpg (115.74 KiB) Viewed 6368 times
LightningChart Support Team, PT
