Page 1 of 1
Multiple ValueRangePalette for AreaSeries
Posted: Tue Mar 06, 2018 11:16 am
by peppemath
Ciao
I have the following problem, depict in figure attached
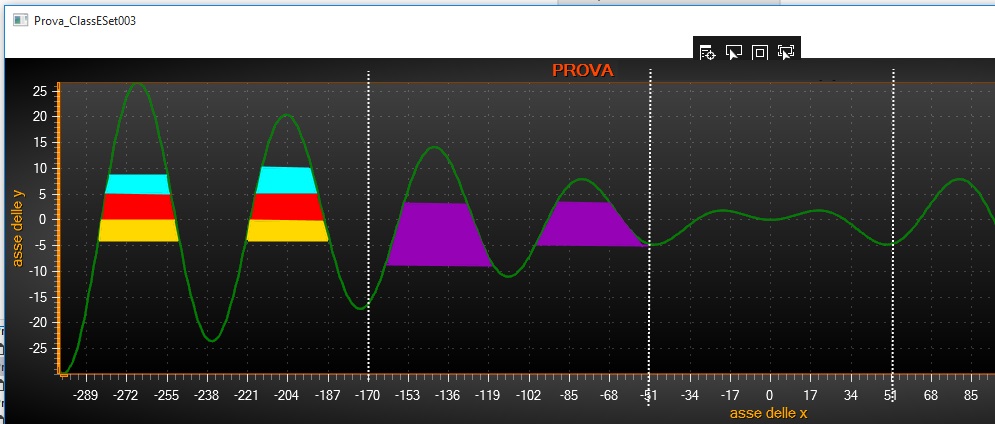
- ChangePaletteForAreaSeries.jpg (116.68 KiB) Viewed 5548 times
For example i want apply from x=-300 to x=-170 a palette of N colors
from x=-170 to x=-51 a palette of M colors
....................
Is possible assign to the same serie multiple palette????
There i a way to obtain this??
Thanks for suggestions
Re: Multiple ValueRangePalette for AreaSeries
Posted: Tue Mar 06, 2018 3:04 pm
by ArctionKestutis
Hello,
I send more extended reply from support email. Here is just short version of answer.
Are you interested in coloring line or area under the curve?
If you want to color line as shown in Demo App example “Line, palette coloring” , when you could have one palette (for Y value range) per Series. You can use several segments/lines with different ValueRangePalette.
You can use AreaSeries or HighLowSeries, which support Limits and Palette. However, it is also per Series.
The simplest example for enabled areaSeries.UseLimits is “Custom axis Ticks” (XY -> Others).
The simplest example for enabled areaSeries.UsePalette is “3D surface cross section” (3D -> Advanced). You can set steps with transparent color (at the bottom) and ValueRangePalette.Type=Uniform.
Finally, you can use PolygonSeries, which has Fill property, where you can set Color, GradientColor, GradientFill, Style etc. That looks to me like simplest and most efficient solution.
All the best.