Page 1 of 1
Resizing chart throws an exception
Posted: Wed Jun 12, 2013 4:57 pm
by symbolick
I am getting the following exception when re sizing a chart, it only happens when i decrease the size below a certain size. From the exception I cannot tell exactly what is going wrong because it appears to be happening internally in lightning chart.
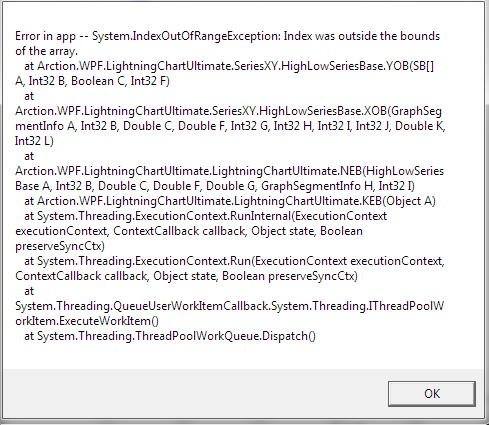
- Exception.PNG (28.05 KiB) Viewed 26696 times
A bit of info of what is being displayed on the charts. The one of the left has a few area series plots and the one on the right has a area series, band.
I am sure this is a situation I have created because I have several lightning charts throughout my application and only on this particular window do I get this exception. The only difference I can see between this chart and other ones that do not produce this error is that there are multiple charts on this screen and it is being displayed using the .ShowDialog() method instead of the .Show().
Re: Resizing chart throws an exception
Posted: Thu Jun 13, 2013 11:19 am
by ArctionJari
I'm not able to reproduce this problem on my computer. Can you send me a Visual Studio demo project that produces this exception? If it is a small project send it to our support email address. Otherwise it's better to use FTP so that our email server doesn't get full.
Re: Resizing chart throws an exception
Posted: Tue Jun 18, 2013 7:16 pm
by symbolick
I am not sure on the support teams email address so I will post the code here. Since the code was produced from a single example window it should be ok to just post it here. This is the xaml file code.
I am not sure if two charts need to be present for this bug to occure but i have several instances of it and the resizing exception has only been thrown on the windows that have multiple charts.
Code: Select all
<Window x:Class="WpfApplication1.MainWindow"
        xmlns="http://schemas.microsoft.com/winfx/2006/xaml/presentation"
        xmlns:x="http://schemas.microsoft.com/winfx/2006/xaml"
        Title="MainWindow" Height="350" Width="525">
    <Grid Name="_mainGrid">
        <Grid.ColumnDefinitions>
            <ColumnDefinition Width="*"/>
            <ColumnDefinition Width="auto"/>
            <ColumnDefinition Width="*"/>
        </Grid.ColumnDefinitions>
        <GridSplitter Grid.Column="1"/>

    </Grid>
</Window>
Below is the .cs file code to that window. There is a long section where I am setting the properties similar to what I have been using in my applications.
Code: Select all
using System;
using System.Collections.Generic;
using System.Linq;
using System.Text;
using System.Threading.Tasks;
using System.Windows;
using System.Windows.Controls;
using System.Windows.Data;
using System.Windows.Documents;
using System.Windows.Input;
using System.Windows.Media;
using System.Windows.Media.Imaging;
using System.Windows.Navigation;
using System.Windows.Shapes;
using Arction.WPF.LightningChartUltimate;
using Arction.WPF.LightningChartUltimate.SeriesXY;

namespace WpfApplication1
{
    /// <summary>
    /// Interaction logic for MainWindow.xaml
    /// </summary>
    public partial class MainWindow : Window
    {
        LightningChartUltimate _chart1;
        LightningChartUltimate _chart2;
        AreaSeries _chart1ASP;
        AreaSeries _chart2ASP;
        AreaSeriesPoint[] _chart1ASPPoints = new AreaSeriesPoint[1000];
        AreaSeriesPoint[] _chart2ASPPoints = new AreaSeriesPoint[1000];
        public MainWindow()
        {
            InitializeComponent();
            _chart1 = new LightningChartUltimate(@"MY KEY GOES HERE");
            _chart2 = new LightningChartUltimate(@"MY KEY GOES HERE");
            _mainGrid.Children.Add(_chart2);
            Grid.SetColumn(_chart2, 2);
            _mainGrid.Children.Add(_chart1);
            Grid.SetColumn(_chart1, 0);
            Loaded += MainWindow_Loaded;
        }


        void MainWindow_Loaded(object sender, RoutedEventArgs e)
        {
            SetupChart(_chart1);
            SetupChart(_chart2);
            _chart1.Name = "Chart1";
            _chart2.Name = "Chart2";
            _chart1ASP = new AreaSeries(_chart1.ViewXY, _chart1.ViewXY.XAxes[0], _chart1.ViewXY.YAxes[0]);
            _chart2ASP = new AreaSeries(_chart2.ViewXY, _chart2.ViewXY.XAxes[0], _chart2.ViewXY.YAxes[0]);
            _chart1ASP.Fill.Color = Colors.Orange;
            _chart1ASP.Fill.GradientFill = GradientFill.Solid;
            _chart1ASP.Fill.Style = RectFillStyle.ColorOnly;
            _chart2ASP.Fill.Color = Colors.Orange;
            _chart2ASP.Fill.GradientFill = GradientFill.Solid;
            _chart2ASP.Fill.Style = RectFillStyle.ColorOnly;

            Random rand = new Random();
            for (int i = 0; i < 1000; i++)
            {
                _chart1ASPPoints[i] = new AreaSeriesPoint(i, 100 * rand.NextDouble());
                _chart2ASPPoints[i] = new AreaSeriesPoint(i, 100 * rand.NextDouble());
            }
            _chart1ASP.Points = _chart1ASPPoints;
            _chart2ASP.Points = _chart2ASPPoints;
            _chart1.ViewXY.AreaSeries.Add(_chart1ASP);
            _chart2.ViewXY.AreaSeries.Add(_chart2ASP);
            _chart1.ViewXY.FitView();
            _chart2.ViewXY.FitView();

            _chart1ASP.Fill.Color = Colors.Orange;
            _chart2ASP.Fill.Color = Colors.Orange;
        }

        void SetupChart(LightningChartUltimate chart)
        {

            chart.ChartRenderOptions.MultiCoreProcessing = MultiCoreProcessing.AllAvailableCores;
            chart.BeginUpdate();

            chart.ThrowChartExceptions = false;
            chart.ViewXY.LegendBox.Visible = true;
            chart.Title.Text = "Title";
            chart.Title.Color = Colors.White;
            chart.HorizontalAlignment = HorizontalAlignment.Stretch;
            chart.VerticalAlignment = VerticalAlignment.Stretch;
            chart.ViewXY.YAxes[0].LogBase = 10;
            chart.ViewXY.YAxes[0].Title.Text = "Y Axes";
            chart.ViewXY.XAxes[0].Title.Text = "X Axes";
            chart.ViewXY.XAxes[0].ValueType = AxisValueType.Number;
            chart.Title.MouseInteraction = false;
            chart.ViewXY.YAxes[0].ScaleType = ScaleType.Logarithmic;
            chart.ViewXY.ZoomPanOptions.IgnoreZerosInLogFit = true;
            chart.ViewXY.YAxes[0].LogZeroClamp = Double.Epsilon;
            chart.Background = System.Windows.Media.Brushes.Transparent;
            chart.ViewXY.ZoomPanOptions.LeftMouseButtonAction = MouseButtonAction.None;
            chart.ChartRenderOptions.AntiAliasLevel = 4;
            chart.ChartRenderOptions.MultiCoreProcessing = MultiCoreProcessing.AllAvailableCores;
            //Chart style settings
            chart.Background = System.Windows.Media.Brushes.LightGray;
            chart.ChartBackground.Color = Colors.LightGray;
            chart.ChartBackground.GradientFill = GradientFill.Solid;
            chart.ViewXY.GraphBackground.Color = Colors.LightGray;
            chart.ViewXY.GraphBackground.GradientFill = GradientFill.Solid;
            chart.BorderBrush = System.Windows.Media.Brushes.Transparent;
            chart.BorderThickness = new Thickness(0);
            chart.ViewXY.GraphBorderColor = Colors.Black;
            chart.ViewXY.XAxes[0].LabelsColor = Colors.Black;
            chart.ViewXY.YAxes[0].LabelsColor = Colors.Black;
            chart.ViewXY.XAxes[0].MajorDivTickStyle.Color = Colors.Black;
            chart.ViewXY.XAxes[0].AxisColor = Colors.Black;
            chart.ViewXY.XAxes[0].AxisThickness = 1;
            chart.ViewXY.XAxes[0].MajorGrid.Color = Colors.DarkGray;
            chart.ViewXY.XAxes[0].MinorGrid.Visible = false;
            chart.ViewXY.XAxes[0].MinorDivTickStyle.Color = Colors.Black;
            chart.ViewXY.XAxes[0].MajorGrid.Pattern = LinePattern.Solid;
            chart.ViewXY.XAxes[0].Title.Font.Size = 11;
            chart.ViewXY.XAxes[0].Title.Color = Colors.Black;
            chart.ViewXY.XAxes[0].Title.Shadow.DropOffset = new PointIntXY(0, 0);
            chart.ViewXY.XAxes[0].Title.Shadow.DropColor = Colors.Transparent;
            chart.ViewXY.XAxes[0].Title.Shadow.ContrastColor = Colors.Transparent;
            chart.ViewXY.XAxes[0].ScaleNibs.Size.Height = 0;
            chart.ViewXY.XAxes[0].ScaleNibs.Size.Width = 0;
            chart.ViewXY.XAxes[0].Title.Visible = false;
            chart.ViewXY.YAxes[0].MajorDivTickStyle.Color = Colors.Black;
            chart.ViewXY.YAxes[0].AxisColor = Colors.Black;
            chart.ViewXY.YAxes[0].AxisThickness = 1;
            chart.ViewXY.YAxes[0].MajorGrid.Color = Colors.DarkGray;
            chart.ViewXY.YAxes[0].MinorGrid.Visible = false;
            chart.ViewXY.YAxes[0].MinorDivTickStyle.Color = Colors.Black;
            chart.ViewXY.YAxes[0].MajorGrid.Pattern = LinePattern.Solid;
            chart.ViewXY.XAxes[0].ValueType = AxisValueType.Number;
            chart.ViewXY.YAxes[0].Title.Font.Size = 11;
            chart.ViewXY.YAxes[0].Title.Color = Colors.Black;
            chart.ViewXY.YAxes[0].Title.Shadow.DropOffset = new PointIntXY(0, 0);
            chart.ViewXY.YAxes[0].Title.Shadow.DropColor = Colors.Transparent;
            chart.ViewXY.YAxes[0].Title.Shadow.ContrastColor = Colors.Transparent;
            chart.ViewXY.YAxes[0].ScaleNibs.Size.Width = 0;
            chart.ViewXY.YAxes[0].ScaleNibs.Size.Height = 0;
            chart.ChartRenderOptions.UseThreadPool = true;
            chart.EndUpdate();
        }
    }
}
This code should create two charts with a area series loaded side by side in a grid. They should load fine but then when you go to re size the window you will should get the same Index was outside of the bounds of the array exception that I have been receiving.
Regards,
Aaron Morrisett
Re: Resizing chart throws an exception
Posted: Wed Jun 19, 2013 11:19 am
by ArctionJari
Ok, thanks for the source code. I was now able to get the exception. It seems that if you resize the window very fast you get the exception. Probably some kind of timing problem in rendering. We will look into this and let you know when we know more.

Re: Resizing chart throws an exception
Posted: Thu Jun 20, 2013 12:13 pm
by ArctionJari
Ok, we found the problem and it is now fixed. The fix will be included in the next release and it will be available in the beginning of August.
Re: Resizing chart throws an exception
Posted: Thu Jun 20, 2013 4:53 pm
by symbolick
OK thanks. I will check back in then. Can you give me a better idea of what is causing the problem so I can try to avoid crashing the chart for the time being. We have a release dates scheduled before august for our application and the only thing it seems I can really do to avoid this is to disable the re sizing of windows.
Regards,
Aaron
Re: Resizing chart throws an exception
Posted: Tue Jun 25, 2013 1:38 pm
by ArctionJari
I'm testing private message sending. Did you receive it?

Re: Resizing chart throws an exception
Posted: Wed Jun 26, 2013 3:31 pm
by symbolick
Yes I received it in my email box but when I click the link it says that I am not authorized to to read private messages. Not sure if this is a setting I can access or if it is a permission given out by the web site admin.
Regards,
Aaron
Re: Resizing chart throws an exception
Posted: Thu Jun 27, 2013 10:01 am
by ArctionJari
That should be fixed now. Sorry about that.
symbolick wrote:Yes I received it in my email box but when I click the link it says that I am not authorized to to read private messages. Not sure if this is a setting I can access or if it is a permission given out by the web site admin.
Regards,
Aaron